Downloads
Due to licensing restrictions, we cannot provide the raw data. However, we provide estimates obtained using the methods that we developed, and made available with scientific publications for reproducibility purposes. Currently, the database is global, at the country level and covers the period from 1998-2018.
| Description | Research article | Data download | Data source | Materials for reproducability |
|---|---|---|---|---|
| Yearly measures of the number of scholars, emigrations, immigrations, net migration rates and other variables, per country | Replication data on Github | Scopus | Github repository | |
| Yearly bilateral flows of scholars between countries | Replication data on Github | Scopus | Github repository |
If you download or use this data, please subscribe to our newsletter to receive updates on the project:
Official Content Guide
More information about how the data is produced and processed can be found in our official data documentation
Any questions & comments
or problems concerning the access to the data, please write to us.
How is the data produced?
Input data
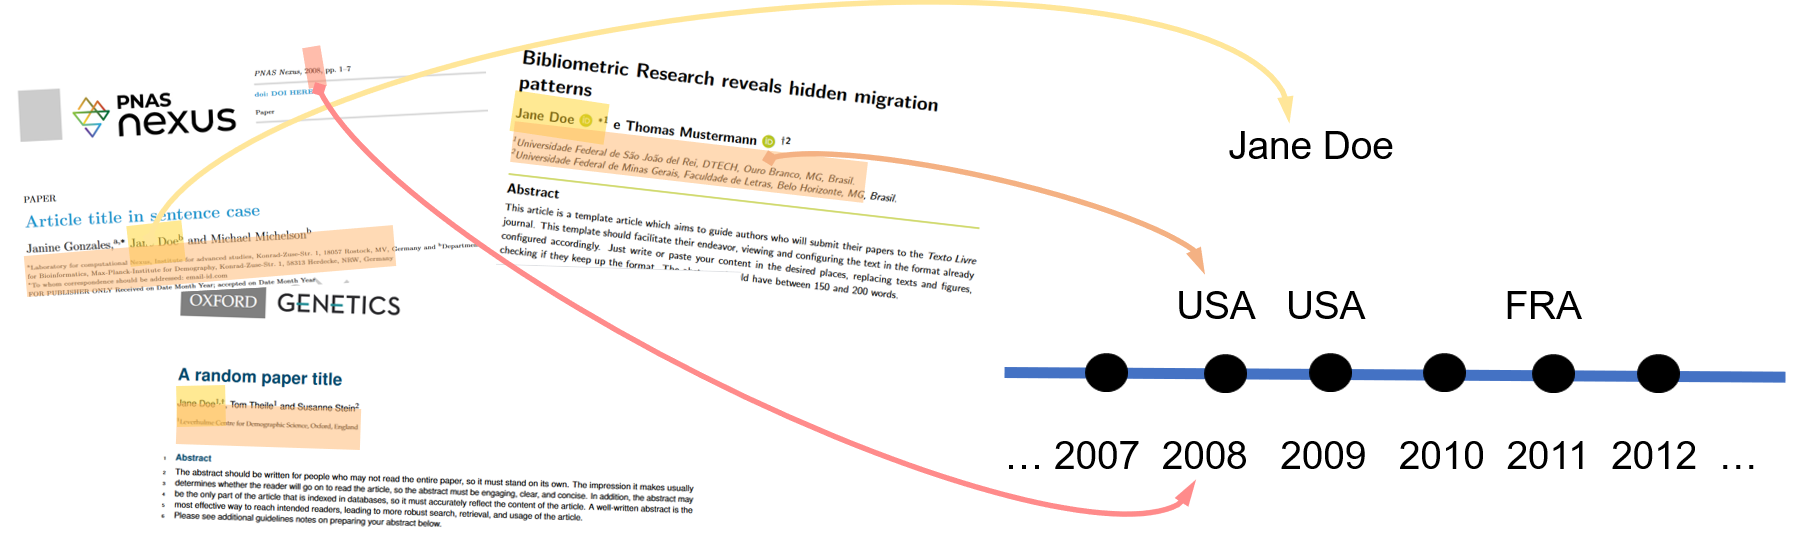
Currently, our main data source is the Scopus bibliometric database because of its high quality in author name disambiguation. It covers the metadata and abstracts from over 50 million articles from more than 9,000 publishers and over 17 million author profiles.
Via the Max Planck Digital Library, we use the infrastructure of the German Competence Centre for Bibliometrics to generate and download 240 million authorship records from the data. One authorship record is the unique combination of author, publication and affiliation addres.
Data processing
We filter out unreliable entries of the Scopus database (please read the Methods and Documentation Working Paper for more information). In the next step, we group the data by year and author:
| year | author | affiliation country |
|---|---|---|
| 2008 | Jane Doe | DEU |
| 2008 | Jane Doe | DEU |
| 2008 | Jane Doe | FRA |
| 2012 | Jane Doe | USA |
If there is more than one affiliation country in one year, we take the most frequent one. If there is a year without any affiliation country, we fill the time up to two years before a publication with the country in the next available year:
| year | author | inferred residence country |
|---|---|---|
| 2006 | Jane Doe | DEU |
| 2007 | Jane Doe | DEU |
| 2008 | Jane Doe | DEU |
| 2010 | Jane Doe | USA |
| 2011 | Jane Doe | USA |
| 2012 | Jane Doe | USA |
Aggregated by country and year, these are the populations of researchers.
Migration events
If the country of residence changes, this will create a "migration event". In our example we register one migration event. The outmigration country is Germany, the inmigration country is the USA. The year of the migration is the first year with a new residence country: 2010.
| year | author | outmigration country | inmigration country |
|---|---|---|---|
| 2010 | Jane Doe | DEU | USA |
The migration numbers for each country are obtained by aggregating all migration events by country and year. The migration rates are calculated by dividing the migration numbers by the country's population of researchers.
Output Data
Country measures
The data is aggregated by country and year.
| year | country | population of researchers | inmigration total | outmigration total | netmigration | outmigration rate | inmigration rate | netmigration rate |
|---|---|---|---|---|---|---|---|---|
| 2016 | DEU | 131310 | 4499 | 4523 | -24 | 0.034 | 0.034 | -0.0002 |
| 2016 | USA | 759857 | 15296 | 14250 | 1046 | 0.020 | 0.019 | -0.0014 |
Country-country flows
The data is aggregated by inmigration country, outmigration country and year. It shows the flows of scholars between all countries with at least one migration event.
| year | outmigration country | inmigration country | number of migrations |
|---|---|---|---|
| 2010 | DEU | USA | 2393 |